

At the end of May 2025, the State Statistics Service of Ukraine finalized the results of the dairy cattle sector’s performance for 2024 and provided updated data on herd numbers, cow productivity, milk production and delivery for processing, and quality grades. As usual, the Analytical Department of the Association of Milk Producers prepared the infographic “Ukraine’s Dairy Map” to visually show the indicators with which Ukraine’s dairy sector entered 2025. It is impressive that despite wartime losses, targeted shelling and destruction, a forced new wave of closures and relocations of farms from war-affected regions, exhausting blackouts, and record-breaking heat from June to September 2024, which caused more than 50% of industrial farms to significantly decline in milk yields, Ukraine’s dairy sector demonstrated significant achievements!
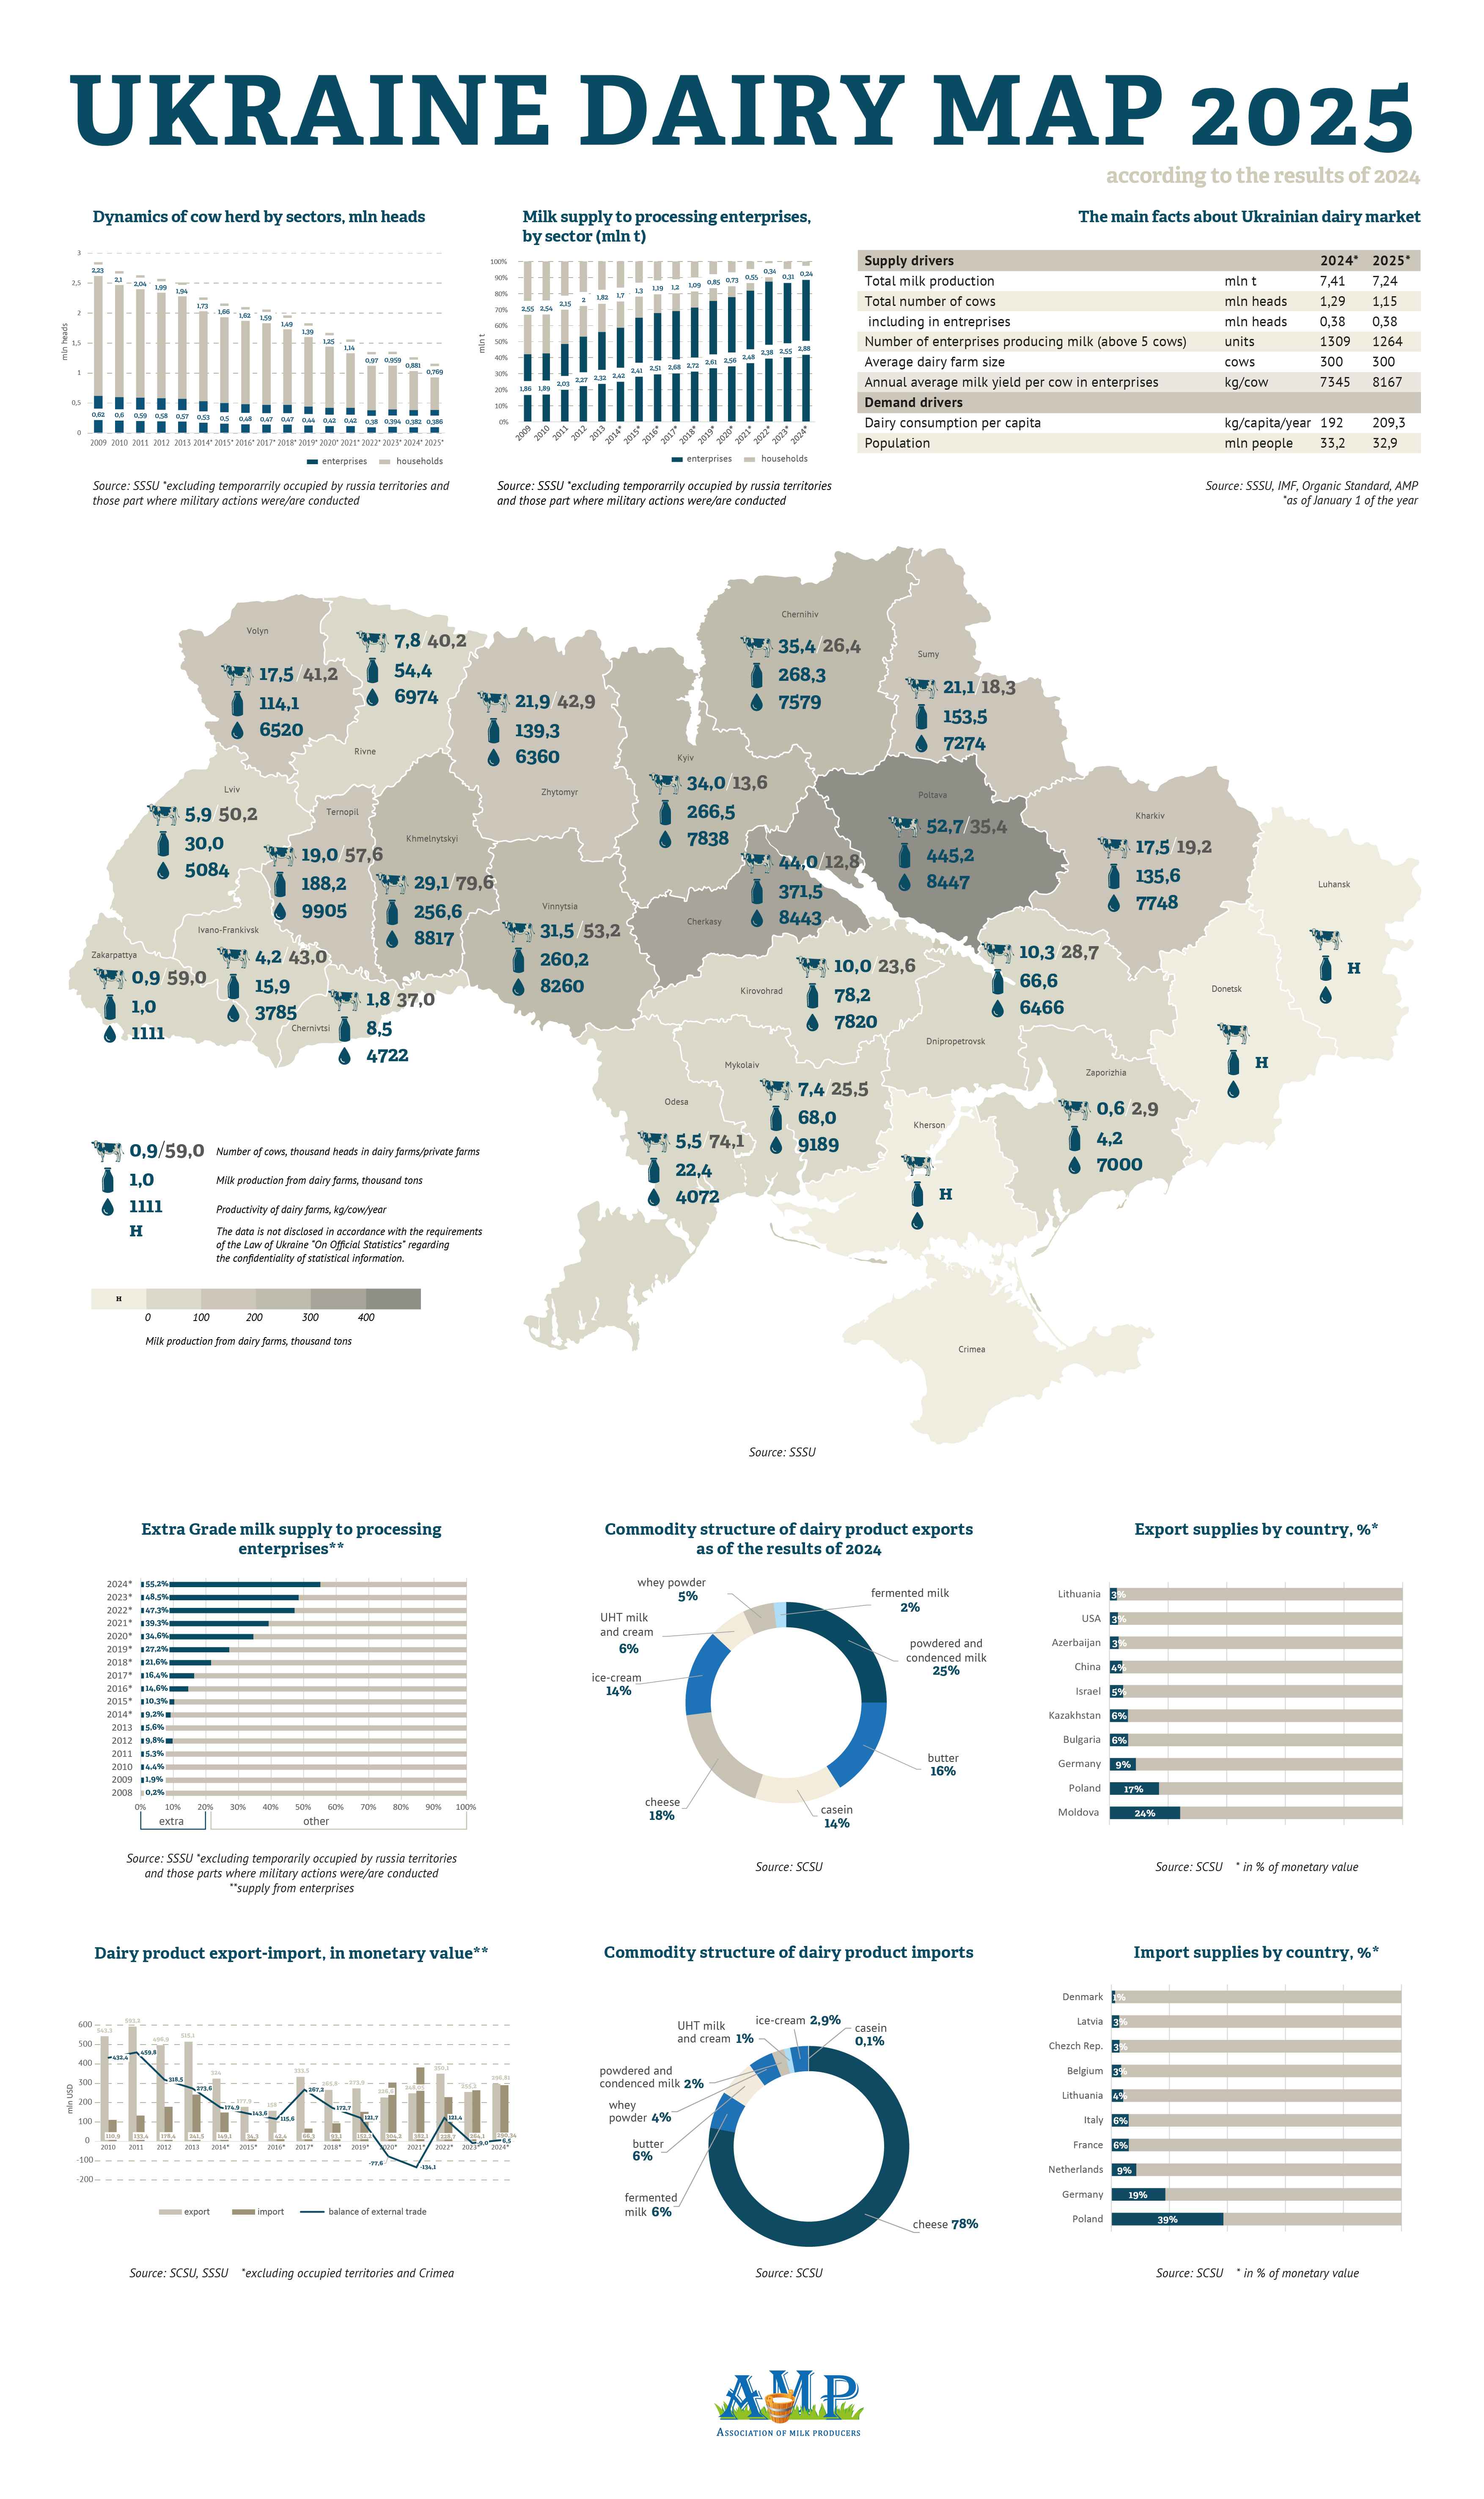
As of January 1, 2025, the number of cows in the industrial sector increased by 1% compared to the previous period.
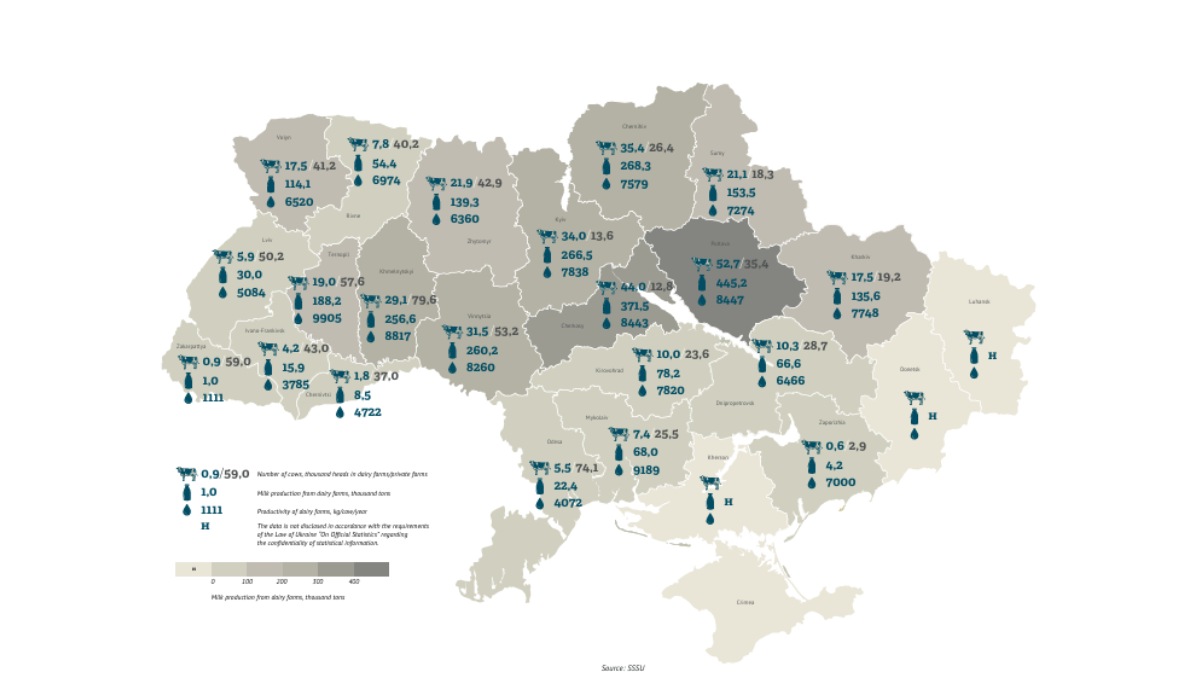
The top five regions by the number of industrial dairy cows:
- Poltava region — 52.7 thousand head
- Cherkasy region — 44 thousand head
- Chernihiv region — 35.4 thousand head
- Kyiv region — 34 thousand head
- Vinnytsia region — 31.5 thousand head
Together, these regions account for 51% of the total industrial dairy herd in Ukraine.
Where is the herd growing?
The largest increase in industrial dairy cow numbers in 2024 was recorded in:
- Mykolaiv region +14%
- Ternopil region +10%
- Khmelnytskyi region +5%
- Cherkasy region +4%
- Kyiv region +3%
However, there are also losses in industrial herd numbers, primarily in war-affected and frontline areas.
The biggest reduction in herd numbers since 2021 occurred in:
- Zaporizhzhia region -88%
- Kharkiv region -47%
- Sumy and Chernivtsi regions -22% each
- Chernihiv region -11%
Industrial milk production: growth despite challenges
In 2024, more than 90% of raw milk delivered for processing came from industrial farms.
As of January 1, 2025, the leading regions by production volumes were:
- Poltava region — 445.2 thousand tons
- Cherkasy region — 371.5 thousand tons
- Chernihiv region — 268.3 thousand tons
- Kyiv region — 266.5 thousand tons
- Vinnytsia region — 260.2 thousand tons
The largest increases in raw milk production over the year:
- Mykolaiv region — +18%
- Ternopil region — +13%
- Khmelnytskyi region — +9%
- Zhytomyr and Poltava regions — +8% each
In contrast, significant declines were recorded in:
- Zaporizhzhia region -87%
- Kharkiv region -45%
- Sumy region -6%
Productivity and quality: new records
Despite the challenges of 2024 — particularly exhausting blackouts and abnormal heat from June to September 2024, which led to a drop in milk yields by more than 25% in over half of the farms — industrial dairy farms showed record productivity growth:
Average yield in the industrial sector reached 8,167 kg per cow per year, which is almost 20% higher compared to pre-war 2021.
Top 5 regions by industrial cow productivity in 2024:
- Ternopil region — 9,905 kg/cow/year
- Mykolaiv region — 9,189 kg/cow/year
- Khmelnytskyi region — 8,817 kg/cow/year
- Poltava region — 8,447 kg/cow/year
- Cherkasy region — 8,443 kg/cow/year
At the same time, milk quality indicators also improved:
- 55% of the milk delivered for processing was Extra Grade, and 25.3% was High Grade.
Consumption and foreign trade
In 2024, the average consumption of dairy products in Ukraine increased to 209.3 kg per person, which is 4% more than in 2023 and 2021.
Despite the war, emigration, and reduced purchasing power, Ukrainians maintain stable demand for dairy products.
In 2024, dairy exports amounted to 118.02 thousand tons, worth $296.81 million — which is +16% compared to 2023 and +20% compared to 2021.
Top 5 export categories:
- Dry and condensed milk — 25%
- Cheese — 18%
- Butter — 16%
- Casein — 14%
- Ice cream — 14%
Imports in 2024 amounted to 60.27 thousand tons, worth $290.34 million.
This means a +10% increase compared to 2023 and -24% compared to 2021 (in monetary terms).
Importantly, 78% of imports were cheeses, a high-margin product.
In 2024, Ukraine maintained a positive trade balance in dairy products, exporting almost twice the volume it imported (118 thousand tons vs. 60 thousand tons), with nearly equal value ($296.81 million in exports vs. $290.34 million in imports).
This indicates the high added value of imported goods (mainly cheese) and the larger commodity volume in exports (e.g., dry milk, butter, casein).
Ukraine’s dairy sector, despite all the hardships and losses of wartime, demonstrates resilience, innovation, and the capacity for recovery.
The year 2024 became a year not only of trials but also of new achievements.
To download “Ukraine’s Dairy Map 2025,” follow the link.
Press Service of the Association of Milk Producers
Follow us on Facebook
Related News